The city that chose cable over the phone
If poor families simply couldn't afford connections, the cheapest one would go first. It didn't.
In the early 1990s, Camden, New Jersey was by most measures the poorest city of its size in the United States. Across the Delaware River from Philadelphia's skyline, it was a city of boarded blocks and public housing, with one of the lowest median incomes in urban America. And in Camden, one household in five had no telephone — at a time when the national rate stood at ninety-four percent. In several of its neighborhoods, only about half the households were on the network at all.
Milton Mueller & Jorge Reina Schement, “Universal Service from the Bottom Up: A Study of Telephone Penetration in Camden, New Jersey,” The Information Society 12(3), 1996; reprinted in Benjamin Compaine (ed.), The Digital Divide (MIT Press, 2001).The standard explanation wrote itself: telephone service costs money, and Camden had none. Case closed. Jorge Reina Schement — a communications researcher who spent 1994 directing research inside the FCC chairman's office on who actually subscribes to the network — and the telecommunications scholar Milton Mueller went to Camden to check. In the winter of 1994 they sat down with fourteen low-income Camden households, eight of them living without a telephone, and mapped a week of each family's communication life. What they found broke the standard explanation in half.
The households with no telephone — the supposedly disconnected poor — were saturated with communication technology. Half of the eight phoneless households subscribed to cable television. Six of the eight owned VCRs. The average phoneless family owned three and a half television sets. Cable cost more per month than basic phone service, yet in homes that had let the dial tone go, the entertainment wire stayed connected. Four of the eight told the researchers plainly that cable mattered more to their quality of life than a telephone. If poverty were the whole story, none of that should have been possible.
View the data
The budget logic of the dial tone
Sit at a Camden kitchen table and the choice stops looking strange. Cable was a flat rate: one predictable number, the same every month. You could budget for it the way you budget for rent. The telephone was different. The monthly line charge was small, but the bill was open-ended — every toll call to a sister in San Juan or a cousin in Georgia, every collect call accepted from a relative in trouble, landed on next month's statement. Of the twelve families in the study who had ever lost phone service, eight were driven off by exactly this: long-distance, collect, or calling-card bills they could not pay. Nobody named the basic monthly rate. The dial tone was affordable. The bill was a monthly lottery ticket written against them.
Mueller & Schement (1996): “When users are driven off the network for economic reasons, usage-related charges are reported as the primary reason in almost all cases.” The phone company's remedy — toll restriction — cost $25 plus a monthly fee that “virtually doubles the cost of local phone service.”When the lottery came up wrong, the family fell behind; the company disconnected the line; and getting back on meant paying off a back bill of $100 to $500 plus a deposit of at least $100. A state program, Link-Up, existed to halve the reconnection charge — and not a single one of the fourteen households had ever heard of it. So Camden churned: on the network some months, off it others, borrowing a neighbor's phone or walking to a pay phone in between. As Mueller and Schement put it, “telecommunications access is a continuum, not a binary choice.” These families were not failing to adopt a technology. They were managing a budget with a precision that would impress an accountant, and the phone — the unpredictable line item — was the one that had to flex.
The finding traveled. FCC chairman Reed Hundt, Vice President Gore, and President Clinton all retold the study's inner-city-mother-with-cable-but-no-phone — Gore and Clinton without attribution, and in one telling she was relocated to Detroit (Mueller & Schement 1996, endnote 11).This picture, simple, familiar, and comfortable, is also wrong… In other words, income alone explains not one of these gaps. Jorge Reina Schement, “Of Gaps by Which Democracy We Measure,” iMP Magazine, 1999
That kitchen-table insight — connection is a household budgeting decision, not a step on a technology-adoption curve — is the seed of everything on this page. Hold onto it. It explains things about 2026 that the word “divide” cannot.
The arithmetic of staying connected
One variable predicts connection better than anything else. It isn't interest, or skill, or age. It's income.
Three times a year since November 1983, the Census Bureau has asked a sample of American households a simple question: is there a telephone in this house? The FCC has published the answers ever since, sliced by income, race, age, and state — one of the longest-running connection datasets in the world, and the raw material for Schement's work at the FCC in 1994.
FCC, “Telephone Subscribership in the United States” series, drawn from the Current Population Survey. As research director of the FCC chairman's Information Policy Project (1994), Schement led penetration studies that fed the universal-service debate ahead of the Telecommunications Act of 1996.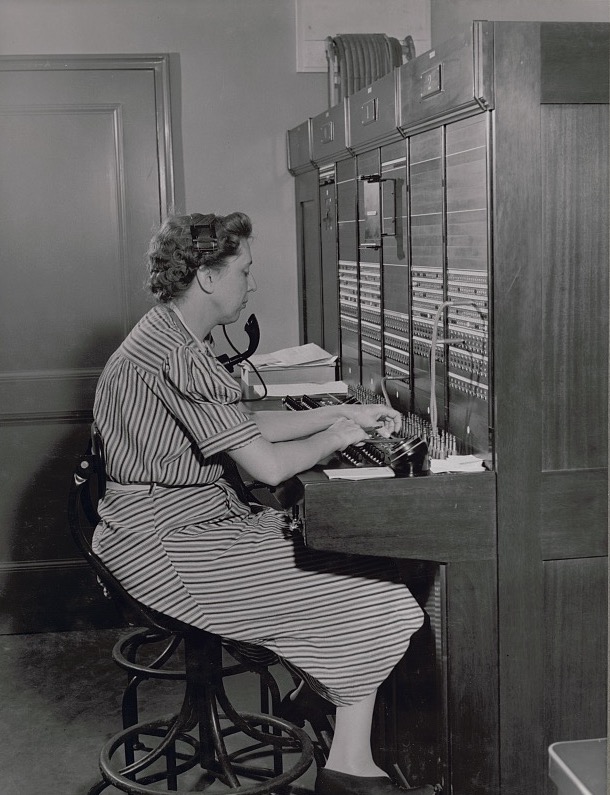
Plot the answers against household income and you get the least surprising chart in this essay — and the most important. Connection climbs step by step with income, from the poorest households to near-total saturation at the top. No other variable — education, age, geography — produces a staircase this steep or this consistent.
View the data
But the staircase hides the mechanism. It is tempting to read it as a price problem: service costs $X, poor households have less than $X, subtract and you get the gap. Schement's Camden work says the real mechanism is volatility, not price. Poor households were not priced off the network once; they were shaken off it repeatedly — by an unpredictable bill, a disconnection, a reconnection deposit — and each shake shows up in the annual average as a lower penetration rate.
This distinction matters because the two diagnoses imply different cures. If the problem is price, you subsidize the monthly rate and declare victory. If the problem is volatility, a rate subsidy helps but doesn't finish the job: the family is still one bad month from disconnection, still facing the deposit when they try to return. The gap, in other words, is not a line poor families stand behind. It is a revolving door.
Same income, different odds
If income explained everything, two families earning the same amount would connect at the same rate. They don't.
Here is where the story stops being comfortable. Take the income staircase from Figure 2 and split each step by race. If the gap were purely economic, the lines would sit on top of each other: a Black household and a white household earning the same $25,000 should face the same arithmetic. Instead, at nearly every income level, Black and Hispanic households connect at lower rates than white households with the same income.
Documented in Schement's Beyond Universal Service (Benton Foundation, 1994; Telecommunications Policy, 1995) for telephones, and confirmed for computers and the internet by NTIA's Falling Through the Net series (1995–2000).View the data
The pattern was already old when the internet arrived. In 1993, among households earning under $5,000, 76.4% of white households had a telephone — against 65.5% of Black households and 66.3% of Hispanic households, same income bracket, same phone prices. When the government began measuring internet access in the late 1990s, the staircase rebuilt itself, and the NTIA did the decisive arithmetic: adjusting statistically for income and education together explained only about half of the 18-point gap separating Black and Hispanic households from the national average. This is the finding that turned a pricing question into a civil-rights question, and it is why Schement kept insisting that “income alone explains not one of these gaps.”
Telephone figures: FCC, Telephone Subscribership (Nov. 1996 report), Table 4, 1993 annual average. Shift-share analysis: NTIA, Falling Through the Net: Toward Digital Inclusion (2000), Figure I-12 — income and education accounted for 8 of the 18 points for Black households, 11 of 18 for Hispanic households.Why would two households with the same paycheck connect at different rates? The research points to accumulated mechanisms rather than a single villain. Income is not wealth: a family earning $25,000 with no savings has less cushion against the bad-bill month than a family earning $25,000 with a parent who can lend. Deposits and credit checks priced in histories of past disconnection. Renters — disproportionately Black and Hispanic — move more often, and every move is a disconnection plus a reconnection fee. And decades of experience with utilities and lenders shaped whose default assumption was that the system would work for them.
Schement also documented the reverse pattern, which delighted him: Black households led all groups in premium cable subscriptions, and Hispanic households showed among the fastest PC-adoption growth of the late 1990s — evidence that these were priorities and strategies, not deficits. See “Of Gaps by Which Democracy We Measure” (1999).Schement — who grew up in San Antonio in a Mexican-American family, and who spent his early career documenting Spanish-language radio — was careful about what this finding did not mean. It did not mean minority households valued communication less; his own data showed the opposite in category after category. It meant the friction was distributed unevenly: same staircase, but some families climbed it carrying weight.
Goods and services: the diffusion clock
Radios conquered America during the Great Depression. Telephones lost ground. That contrast contains a whole theory of the digital divide.
By the late 1990s Schement had a puzzle worth a theory. Some communication technologies spread to essentially every American household within a generation, poor included. Others crawled for the better part of a century and never quite got there. The fast ones and the slow ones were all useful; all got cheaper over time. What separated them?
His answer came from lining up the adoption curves. Radio: under 10% of households in 1925, 46% by 1930, 82% by 1940 — a rocket, and the striking part is when it flew. Through the worst economy in American history, poor families kept buying radios. Television did it again, faster: under one household in ten in 1950, over nine in ten by 1965. The VCR did it a third time: 2% in 1980, about 70% by 1990.
All diffusion figures in this section are Schement's own, from “Of Gaps by Which Democracy We Measure” (iMP Magazine, December 1999), drawing on Census and industry data.
Now the slow lane. The telephone took eighty years from the first practical exchange in 1878 to reach three-quarters of households, and didn't flatten out — above 90% — until about 1970. Electricity took from 1907 until 1956 to reach near-total coverage, sagging visibly through the Depression. Cable television, born in the 1940s, needed three decades just to reach 10% of households. And during the same Depression years when radio ownership nearly doubled, telephone penetration fell — from 40.9% of households in 1930 to 36.9% in 1940. Families kept the radio and gave up the phone.
Telephone series: FCC, Trends in Telephone Service (2008), Table 6.2, from Census Historical Statistics of the United States — 35.0% (1920), 40.9% (1930), 36.9% (1940), 61.8% (1950), 90.5% (1970).View the data
The pattern, Schement argued, isn't about the technology's usefulness or even its sticker price. It's about the shape of the payment. Radio, TV, and the VCR are information goods: you buy the box once. A poor family can save toward a one-time purchase — skip it in a bad month, buy it in a good one — and once the box is in the house, no one can take it away. The telephone, electricity, and cable are information services: they demand a decision to pay every month, forever, and they ride on infrastructure someone must build to your door. A service can be lost in any bad month. For a family whose bad months are frequent, that difference is everything — it is Camden's kitchen-table math, generalized across a century.
Goods require a one-time purchase for which the household can save; whereas information services require a decision to pay every month. That explains why the purchases of radios skyrocketed during the Depression, while the telephone and electrification faltered. Schement, “Of Gaps by Which Democracy We Measure,” 1999
And the two kinds of technology produce two kinds of gap. Goods create gaps that close on their own: in 1956, 90% of the richest quarter of households had a television but only 55% of the poorest quarter did — a 35-point chasm. Ten years later it was gone, erased by falling prices and saved-up purchases, no policy required. Services create gaps that stay. The telephone gaps documented from the late 1970s onward — the poor, single mothers, Black and Hispanic households, inner cities — persisted through decades of subsidy programs, because a falling price cannot fix a volatile bill.
View the data
Temporary gaps, permanent gaps
The question is never “is there a divide?” It's “which kind?” — because one kind fixes itself and the other never does.
In 2000, Schement and Scott Forbes turned the pattern into a usable policy instrument. Every new technology, they observed, produces gaps at first — early adopters are always richer, more urban, more educated. So pointing at a gap proves nothing. The diagnostic question is what the gap does over time.
Schement & Forbes, “Identifying Temporary and Permanent Gaps in Universal Service,” The Information Society 16(2), 2000.A temporary gap narrows as prices fall and the technology matures: the have-nots are simply late, and the market delivers them. Television's income gap was temporary. A permanent gap survives falling prices, because its cause isn't the price — it's the monthly-payment structure, the volatility of poor households' budgets, deposits and credit screens, and infrastructure that doesn't reach everyone. The telephone gap was permanent: a hundred years after the first exchange, with basic service cheaper than ever, millions of households were still cycling on and off the network. Permanent gaps do not age out. They are the ones, Schement and Forbes argued, that justify policy — and the only ones policy can honestly claim credit for closing.
Notice what this framework quietly does: it dissolves the era's favorite argument. Late-1990s skeptics of “digital divide” policy pointed to the closing gaps — computer prices falling, adoption rising everywhere — and concluded the whole problem was temporary. Advocates pointed to the gaps that weren't budging. The Schement–Forbes framework says both sides were reading real data and missing the point. Gaps are not one thing. Sort them first; argue after.
The same curve, four times over
Telephone, computer, internet, broadband: each time, a new technology; each time, the same families waiting at the bottom of the curve.
If the framework is right, it should predict. And it did. Each time a new connection technology arrived, its adoption curve started the same way — steep among the affluent, flat among the poor — and then split along the fault line the framework expects: the parts of the gap caused by novelty and price closed; the parts caused by monthly bills and missing infrastructure did not.
View the data
The NTIA's Falling Through the Net reports — the studies that put the phrase “digital divide” into national circulation, drawing on the research tradition Schement helped build — tracked the internet's version of the staircase through the late 1990s. The overall numbers rose fast enough to make optimists. The composition of who was rising did not — the 1999 edition warned that the divide by race had widened into what it called a “racial ravine.”
NTIA, Falling Through the Net (1995, 1998, 1999, 2000). The 1999 edition was subtitled “Defining the Digital Divide.” Schement served as an advisor to the Clinton-era NTIA work and his FCC penetration studies are part of its documented lineage.And the modern data has one more Camden in it. Today the fastest-growing form of “connection” among low-income households is the smartphone-only home: a phone plan, but no wired broadband. Pew calls it smartphone dependence. Schement would call it 1994 again — the household keeping the connection it can budget for and shedding the one it can't, applying for jobs and doing homework through a five-inch screen. The technology changed completely. The kitchen-table math did not.
A hundred-year social contract
Universal service isn't a subsidy program that keeps needing rescue. It's a promise the country keeps renegotiating — and occasionally breaks.
Schement's deepest reframe was historical. Americans tend to discuss connection programs as welfare — line items to be trimmed. He argued they are something older and stranger: a social contract, running back to the Communications Act of 1934, which declared it national policy “to make available, so far as possible, to all the people of the United States… a rapid, efficient, Nation-wide… communication service with adequate facilities at reasonable charges.” The promise has been rewritten for each new network — and each rewrite happened only after someone demonstrated, with data, that the market alone wasn't delivering it.
Communications Act of 1934, §1. Schement developed the social-contract framing across two decades, from his mid-1990s Benton Foundation work to “Broadband, Internet, and Universal Service” (2009) and the Horrigan & Schement German Marshall Fund brief Broadband as Civic Infrastructure (2021).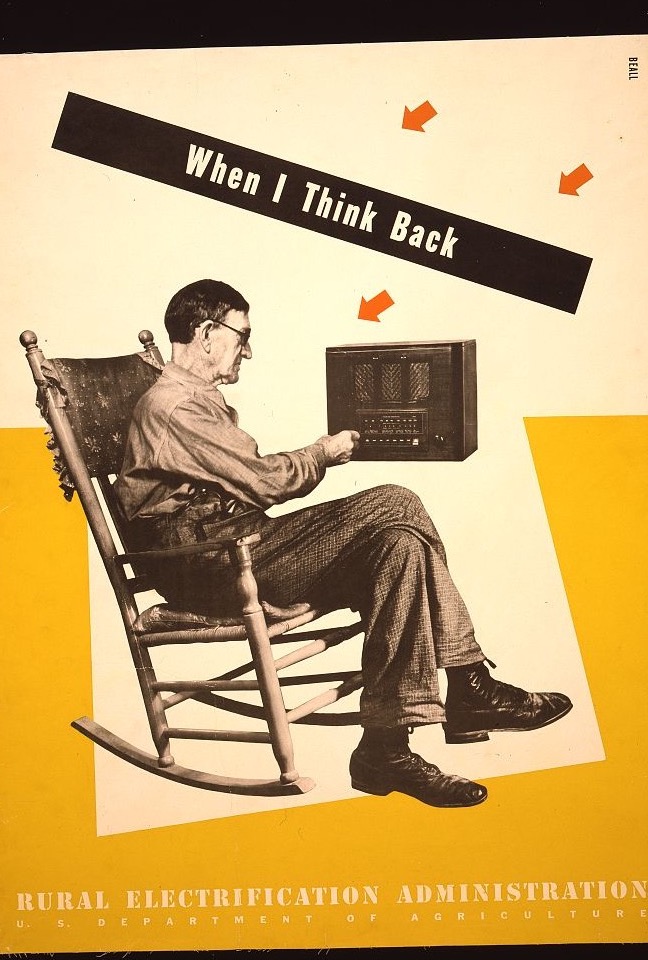
Read the timeline with the framework in mind and it stops looking like miscellaneous legislation. Each intervention targets a permanent gap mechanism, not a temporary one. Lifeline (1985) attacked the monthly bill. Link-Up attacked the reconnection deposit — a program that only makes sense once you know about churn. E-Rate (1997) wired the institutions — schools and libraries — that serve people the home market skips. The 1996 Act's Section 254 wrote the whole idea into law as an evolving standard: universal service is whatever communication a citizen needs for “education, public health, and public safety,” a definition designed to be renegotiated as the network changes.
Telecommunications Act of 1996, §254(c): universal service is “an evolving level of telecommunications services… taking into account advances in telecommunications and information technologies.” Schement's FCC penetration research (1994) is part of the empirical record behind the universal-service debate; he later served on the FCC's 2008–09 transition review and testified as the expert on the digital divide in ALA v. United States (2001).Then came the sharpest natural experiment in the story. During the pandemic — with an estimated 17 million schoolchildren unable to get online for class, the “homework gap” made suddenly visible — Congress created what became the Affordable Connectivity Program: $30 a month off a broadband bill for low-income households. It was the largest broadband-affordability effort in American history, and it was aimed squarely at the mechanism Camden revealed: not the price of the service, but the fragility of the monthly payment.
Horrigan & Schement, Broadband as Civic Infrastructure: Community Empowerment, Equity, and a Digital New Deal (German Marshall Fund, March 2021) — written as the ACP's predecessor (the Emergency Broadband Benefit) was being designed — argued for exactly this: treating broadband like the civic infrastructure of the New Deal era, with the federal government as consistent funder.By early 2024, roughly one in six American households was enrolled. Then Congress declined to renew the funding, and in June 2024 the program simply stopped — the first time in the ninety-year history of the social contract that a universal-service benefit of that scale was withdrawn from tens of millions of households at once. The framework makes a cold prediction about what happens next: the gap the ACP was closing is a permanent-type gap, so it does not stay closed on goodwill. Households that lose the $30 don't “churn off” cable-style in theory — they cancel, downgrade to phone-only plans, or fall behind. The revolving door starts turning again.
Unequal access to broadband Internet threatens to undermine the ability of Americans to participate in their economy, their communities, and in their democracy. Horrigan & Schement, Broadband as Civic Infrastructure, 2021
Intelligence, on subscription
Generative AI is the fastest-adopted technology ever measured in America. The framework in this essay says: look closer at what, exactly, is being adopted.
Schement's data ends where this chapter begins. What follows is not his research — it is his framework, applied by the authors of this site to a technology he never measured, using the same kind of federal and survey data he always insisted on. On November 30, 2022, OpenAI released ChatGPT. Two years later, economists at the Federal Reserve Bank of St. Louis and Harvard ran the comparison this essay has been building toward: they asked adults the same questions the Census Bureau asked about computers in 1984, and lined up the curves. Generative AI's overall adoption — 45.5% of adults two years in — was more than double the PC's at three years (19.7%) and the internet's at two (21%). Nothing in the hundred-year record diffuses like this.
This chapter is marked as new analysis to keep the line clear: Parts I–VII summarize Jorge Reina Schement's published research; Part VIII extends his temporary-vs-permanent-gaps framework to 2023–2026 AI-adoption data. Every number is cited in the notes and in the sources list below. Bick, Blandin & Deming, “The Rapid Adoption of Generative AI” (NBER Working Paper 32966; Real-Time Population Survey, Aug.–Nov. 2024, adults 18–64), Figure 2. PC baseline: 1984 CPS Computer Use Supplement, three years after the IBM PC. Internet baseline: 21% of U.S. adults two years after 1995 commercialization (ITU).View the data
Why so fast? The framework's answer sits in the bottom row of Figure 9. The PC spread through offices — 25% of workers, but barely 5% of homes, because a home computer was an expensive information good a family had to save for. Generative AI inverted that: its home adoption (37.7%) outruns its work adoption, because the entry price is zero. A free chatbot inside a phone you already own has no purchase to save for, no installation, no deposit, no monthly bill. By the logic of Part IV, the access gap for basic AI should behave like a radio gap, not a telephone gap — and close on its own. So far it has: use among U.S. adults has climbed 18% → 23% → 34% → 44% in four years, faster than any curve in Figure 7.
Bick, Blandin & Deming note that “many genAI products are free or inexpensive and user-friendly,” and that genAI's speed advantage over the PC is driven by non-work adoption. Trend: Pew Research Center, share of U.S. adults who have used ChatGPT — 18% (July 2023), 23% (Feb. 2024), 34% (Feb.–Mar. 2025), 44% (Feb. 2026). About half of adults now use some AI chatbot.And yet: split the users open and the oldest staircase in this essay is standing inside the newest technology. In 2025, 52% of Americans with postgraduate degrees had used ChatGPT — against 18% of those with a high school education or less. A NORC survey the same year found professional AI use running 34% among people earning $100,000-plus and 9% among those earning under $30,000. Ten percent of seniors have tried it. The access door is open to everyone; who walks through it, and what they do inside, is stratifying along exactly the lines Schement spent fifty years measuring.
Education: Pew (2025) — postgraduate 52%, bachelor's 51%, some college 33%, high school or less 18%; age: under-30 58% vs. 65+ 10%. Income (professional use): NORC AmeriSpeak for Brookings, June 2025 — $100,000+ 34% vs. under $30,000 9%; by education, 33% (BA+) vs. 5% (no diploma). Bick et al. find the education gradient of genAI use at work in 2024 nearly matches the gradient of computer use at work in 1984.View the data
The $20 staircase
Here is where the goods-and-services clock from Part IV starts ticking. Basic AI is free the way broadcast radio was free. But frontier AI — the newest models, the higher usage caps, the faster answers — is sold the way the telephone was sold: as a metered monthly service, typically $20 a month, sometimes $200. Four years into the fastest adoption curve in this essay, Bank of America's payment data can find only about 3% of households paying for any AI subscription at all — concentrated, of course, among those earning over $125,000. Intelligence itself is being packaged as an information service, and Part IV's rule about information services has never once failed: gaps in goods close; gaps in monthly services persist.
Bank of America Institute, “Not quite mAInstream: a consumer AI adoption profile” (Feb. 2026 card data): ~3% of BofA households paid for AI services, median $20/month, skewed to households earning $125,000+.The framework, applied honestly, returns a split verdict. The access gap looks temporary: free tiers, phones everyone already owns, adoption doubling down the age and education ladder — Pew's lowest-income teen households gained awareness faster than any other group, and Black and Hispanic teens now use ChatGPT for schoolwork at higher rates than white teens (31% and 31%, against 22%) — the same pattern Schement delighted in when Black households led the nation in premium cable: not a deficit of interest, but a strategy. The depth gaps look permanent: a skills-and-education gradient that has reproduced the 1984 computer-at-work staircase almost line for line; a subscription model that prices the best tools as a recurring bill; and underneath it all, the broadband subscription gap of Part VI — you cannot churn onto a chatbot when the home connection itself is churning.
Teens: Pew Research Center (Sept.–Oct. 2024, teens 13–17) — 26% used ChatGPT for schoolwork, double 2023's 13%; Black teens 31%, Hispanic teens 31%, white teens 22%. Awareness in under-$30,000 households rose 26 points in one year.What would Schement do with this moment? The record of Parts I–VII suggests an answer: he would count. Three times a year, by income, race, education, and state — not “have you tried a chatbot,” but the questions that found Camden: Who is paying for which tier? Who churns off when the budget tightens? Whose schoolwork, job applications, and medical questions run through the free model, and whose through the frontier one? The 1934 Act promised communication service “to all the people of the United States… at reasonable charges,” and every generation since has had to renegotiate what that covers. The evidence in this chapter says the negotiation over intelligence has already begun — about four years behind the adoption curve, exactly on schedule.
Today's gaps: which kind are they?
Seven connection gaps from the 2020s. Before you open each verdict, make your own call: will this one close by itself — or is it built to last?
The point of a framework is that other people can use it. Below are seven gaps you can read about in this morning's news. For each, ask the Schement–Forbes questions: Is the barrier a one-time cost or a recurring one? Does closing it require infrastructure someone must be paid to build? Has this gap's ancestor closed before on its own — or has it survived every price drop since 1878?
If you found yourself answering “permanent” more often than the news coverage does — that is the framework working. Prices keep falling, and that keeps solving the temporary gaps. What's left over, by definition, is the persistent gap: the one made of monthly bills, thin budgets, deposits, and unbuilt last miles. It was there when the network carried voices. It is there now that the network carries everything else.
The man who counted phones
Jorge Reina Schement was born in San Antonio, Texas, and took his PhD at Stanford's Institute for Communication Research in 1976. He began his career documenting Spanish-language radio in the Southwest — who owned the stations that spoke to his community, and who was allowed to. From there his work widened into a single, career-long question: who gets to participate in the information society, and on what terms?
Schement & Gutiérrez, Spanish-Language Radio in the Southwestern United States (UT Center for Mexican American Studies, 1979). His 1981 study of minority station ownership (with Singleton) is part of the research record cited in the era of Metro Broadcasting, Inc. v. FCC (1990).In 1994 he directed the Information Policy Project in the office of FCC chairman Reed Hundt, producing the telephone-penetration research that helped shape the universal-service provisions of the Telecommunications Act of 1996 — and that fed the body of work from which the “digital divide” framing grew. He co-founded the Institute for Information Policy at Penn State, served as dean of the Rutgers School of Communication and Information, became Rutgers' first vice president for diversity and inclusion, testified as the digital-divide expert in ALA v. United States, and served on the Benton Foundation board and the FCC's Obama-era transition review. He retired from Rutgers as Distinguished Professor Emeritus at the end of 2024, after publishing more than 250 works across five decades.
This page says his research “helped shape” and “fed into” these developments deliberately: the digital divide was recognized through the work of many researchers and the NTIA's own reports. Schement's distinctive contributions are the ones this essay is built on — the household-budget mechanism, the goods/services distinction, and the temporary/permanent framework.What makes his work durable is its method: start from the household, not the network. Ask what the family at the kitchen table is actually deciding, and the mysteries dissolve — why the poor had cable but no phone, why radios sold through the Depression while telephones went dark, why a smartphone plan survives a budget crisis that kills the broadband bill. The gap persists because the arithmetic persists. Change the arithmetic, he spent fifty years arguing, and you change who belongs to the republic.
Sources & further reading
- Mueller, M. & Schement, J.R., “Universal Service from the Bottom Up: A Study of Telephone Penetration in Camden, New Jersey”, The Information Society 12(3), 1996 (free full text, Rutgers repository). Reprinted in B. Compaine (ed.), The Digital Divide: Facing a Crisis or Creating a Myth?, MIT Press, 2001.
- Schement, J.R., “Beyond Universal Service: Characteristics of Americans Without Telephones, 1980–1993”, Telecommunications Policy 19(6), 1995 (first issued as Benton Foundation Working Paper No. 1, 1994).
- Schement, J.R., “Of Gaps by Which Democracy We Measure”, iMP Magazine, December 1999 (archived).
- Schement, J.R. & Forbes, S.C., “Identifying Temporary and Permanent Gaps in Universal Service”, The Information Society 16(2), 2000.
- Horrigan, J.B. & Schement, J.R., Broadband as Civic Infrastructure: Community Empowerment, Equity, and a Digital New Deal, German Marshall Fund, March 2021; and “Competition won't solve the digital divide — communities will”, The Hill, June 2021.
- FCC, Telephone Subscribership in the United States (Current Population Survey series, 1984–present); Trends in Telephone Service (2008), Table 6.2 (telephone penetration 1920–2007).
- NTIA, Falling Through the Net reports (1995, 1998, 1999, 2000) and A Nation Online (2002).
- Pew Research Center, Internet & Broadband Fact Sheet; Mobile Technology and Home Broadband reports.
- Schement's 2025 curriculum vitae (Rutgers), the master bibliography of 250+ works.
Part VIII sources (new analysis)
- Bick, A., Blandin, A. & Deming, D., “The Rapid Adoption of Generative AI”, NBER Working Paper 32966 (Real-Time Population Survey, Aug.–Nov. 2024) — the genAI-vs-PC-vs-internet speed comparison and education gradients.
- Pew Research Center: ChatGPT use, 2023–2025; Americans & AI 2026; teens & ChatGPT for schoolwork.
- NORC AmeriSpeak survey for Brookings, “How are Americans using AI?” (June 2025) — income and education gradients in professional use.
- Bank of America Institute, “Not quite mAInstream: a consumer AI adoption profile” (2026) — the ~3% of households with paid AI subscriptions.
Colophon
This page is an independent explainer; it is not affiliated with Dr. Schement. Parts I–VII summarize his published research; Part VIII is new analysis by this site's authors, applying his framework to 2023–2026 data. Charts follow Edward Tufte's principles — direct labels, range-frame axes, small multiples, and no ink that isn't data. Colors are from Sanzo Wada's A Dictionary of Color Combinations (1933–34): Dusky Green for the page's structure, English Red for its typographic sparks, and Helvetia Blue, Carmine, Raw Sienna, and Cerulean Blue reserved for data, on an ivory paper with Wada's Black and Slate for ink. The chart palette was machine-checked for color-blind separation and contrast, and every figure carries a “view the data” table. Photographs and the REA poster are from the Library of Congress (Prints & Photographs Division; no known restrictions), and the little communication machines between chapters were drawn for this page. Built as one HTML file, three photographs, no frameworks — in the spirit of the explainers it admires, and owes its existence to: Alex Tabarrok's Rent Control: The Ceiling Trap, which showed that a single stubborn research finding deserves a whole page, and Adil Moujahid's visual introduction to the Riemann Hypothesis, which inspired that one in turn.
This site was made with Fable 5 by John Erik Metcalf. If you'd like to build something like this yourself — for research you love, or research you wrote — here is how, including the prompt.
The Persistent Gap · An explainer built on the research of Jorge Reina Schement · 2026